Saturday, June 22, 2013

Using URL Resources WAS


If one needs to dynamically update the resources on a running applications the below link would definitely help in how to achieve this effect.

http://www.ibm.com/developerworks/websphere/library/techarticles/0502_botzum/0502_botzum.html

Sunday, April 14, 2013

Java- J2EE Design Patterns


Definition of Design Patterns


design pattern is a general reusable solution to a commonly occurring problem within a given context in software design. A design pattern is not a finished design that can be transformed directly into source or machine code. It is a description or template for how to solve a problem that can be used in many different situations. Patterns are formalized best practices that the programmer must implement themselves in the application.

Extracts of the exact classification of Design Patterns


Design patterns were originally grouped into the categories: creational patternsstructural patterns, and behavioral patterns, and described using the concepts of delegationaggregation, and consultation. For further background on object-oriented design, see coupling and cohesioninheritanceinterface, and polymorphism. Another classification has also introduced the notion of architectural design pattern that may be applied at the architecture level of the software such as the Model–View–Controller pattern.

Link of important design patterns with examples http://www.javacamp.org/designPattern/index.html


Design patterns reside in the domain of modules and interconnections. At a higher level there are architectural patterns that are larger in scope, usually describing an overall pattern followed by an entire system.


Wednesday, July 21, 2010

Horizontal Scaling Topology


Horizontal scaling topology

Horizontal scaling exists when there are members of an application server cluster on multiple physical machines. Having cluster members on several machines lets a single application span the machines, yet still present a single system image.

The following figure shows an example of horizontal scaling.


In this example, the Web server on Machine B distributes requests to clustered Application Servers on Machines C and D. Cluster members on Machines C and D are created in the same cluster.

You can combine a load balancer to distribute client HTTP requests with clustering, to reap the benefits of both types of horizontal scaling. The Load Balancer topology topic describes this system configuration.

Typical use

Horizontal scaling provides the increased throughput of vertical scaling topologies but also provides failover support. This topology lets you handle Application Server process failure and hardware failure without significant interruption to client service. You can also use horizontal scaling to optimize the distribution of client requests through mechanisms, such as workload management or remote HTTP transport

Vertical Scaling Topology

Vertical scaling topology
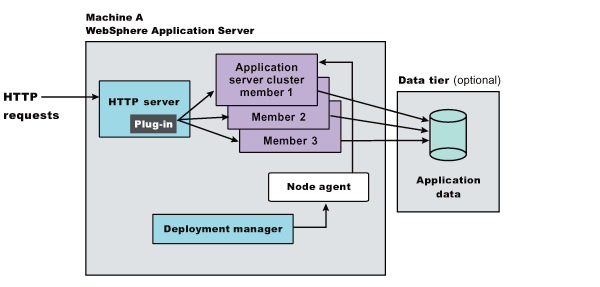
Vertical scaling refers to setting up multiple application servers on one machine, usually by creating cluster members.


This topology illustrates a simple vertical scaling example, with multiple cluster members of an Application Server on Machine A. You can also implement vertical scaling on more than one machine in a configuration. Combine vertical scaling with other topologies to boost performance and throughput.

Typical use

Vertical scaling offers the following advantages:


Increased processing power efficiency. An instance of an application server runs in a single Java virtual machine (JVM) process. However, the inherent concurrency limitations of a JVM process prevent it from fully utilizing the processing power of a machine. Creating additional JVM processes provides multiple thread pools, each corresponding to the JVM process associated with each Application Server process. This correspondence avoids concurrency limitations and lets the Application Server use the full processing power of the machine.
Load balancing. Vertical scaling topologies can use the WebSphere Application Server workload management facility.
Process failover. A vertical scaling topology also provides failover support among Application Server cluster members. If one Application Server instance goes offline, the other instances on the machine continue to process client requests.

Single machine vertical scaling topologies have the drawback of introducing the host machine as a single point of failure in the system. Vertical scaling on multiple machines avoids the single point of failure.

Instructions

To set up a vertical scaling topology, use the administrative console to configure a set of Application Server cluster members that reside on the same machine.

It is recommended that you plan vertical scaling configurations ahead of time. However, because vertical scaling does not require any special installation steps, you can implement vertical scaling whenever it is needed.

While you are deciding how many cluster members to create on a machine, take these factors into account:

The design of the application. Applications that use more components require more memory, limiting the number of cluster members you can run on a machine.
The hardware environment. Vertical scaling works best with plenty of memory and processing power. Eventually there is a point of diminishing returns on any machine, where the overhead of running more cluster members cancels out the benefits of adding them.

The best way to ensure good performance in a vertical scaling configuration is to tune a single instance of an Application Server for throughput and performance, then incrementally add cluster members. Test performance and throughput as you add each cluster member. Always monitor memory use when you are configuring a vertical scaling topology, so you do not exceed available physical memory on the machine.


--------------------------------------------------------------------------------

Garbage Collector

As the system runs, various Java objects are created. Some of these objects are
long-lived, and some are not. The ones that are not become de-referenced, which
means that the JVM no longer has a link to them because they have ceased to be useful.

These may be variables that were used for methods which have already returned
their values, objects retrieved from the database for a user that is no longer logged
on, or a host of other things. These objects sit in memory and fill up the heap space
until the JVM decides it's time to clean them up.

Normally, when garbage collection (GC) runs, it stops all processing in the JVM
while it goes through the heap looking for dead objects. Once it finds them, it frees up the memory they were taking up, and then processing can continue. If this happens in a server environment, it can slow down the processing of requests, as all processing comes to a halt while GC is happening.

There are some JVM switches that you can enable which can reduce the amount
of time processing is halted while garbage collecting happens. These can improve the
performance of your Liferay installation if applied properly. As always, you will need to use a profiler to monitor garbage collection during a load test to tune the numbers properly for your server hardware, operating system, and application server.
The Java heap is divided into sections for the young generation, the old generation,
and the permanent generation. The young generation is further divided into
three sections: Eden, which is where new objects are created, and two “survivor
spaces,” which we can call the From and To spaces.

Garbage collection occurs in stages. Generally, it is more frequently done in the
young generation, less frequently done in the old generation, and even less frequently done in the permanent generation, where long-lived objects reside. When garbage collection runs in the young generation, Eden is swept for objects which are no longer referenced. Those that are still around are moved to the “To” survivor space, and the “From” space is then swept. Any other objects in that space which still have references to them are moved to the “To” space, and the “From” space is then cleared out altogether. After this, the “From” and the “To” spaces swap roles, and processing is freed up again until the next time the JVM determines that garbage collection needs to run.

After a predetermined number of “generations” of garbage collection, surviving
objects may be moved to the old generation. Similarly, after a predetermined number
of “generations” of garbage collection in the old generation, surviving objects may be moved to the permanent generation.By default, the JDK uses a serial garbage collector to achieve this. This works very well for a short-lived desktop Java application, but is not necessarily the best performer for a server-based application like Liferay. For this reason, you may wish to switch to the Concurrent Mark-Sweep (CMS) collector.

Rather than halting application processing altogether, this garbage collector
makes one short pause in application execution to mark objects directly reachable
from the application code. Then it allows the application to run while it marks all objects which are reachable from the set it marked. Finally, it adds another phase called the remark phase which finalizes marking by revisiting any objects modified while the application was running. It then sweeps through and garbage collects. This has the effect of greatly reducing the amount of time that execution needs to be halted in order to clean out dead objects. Just about every aspect of the way memory management works in Java can be tuned. In your profiling, you may want to experiment with some of the following settings to see if any of them can increase your performance.NewSize, MaxNewSize: The initial size and the maximum size of the New or
Young Generation.


+UseParNewGC: Causes garbage collection to happen in parallel, using multiple
CPUs. This decreases garbage collection overhead and increases application throughput.

+UseConcMarkSweepGC: Use the Concurrent Mark-Sweep Garbage Collector.
This uses shorter garbage collection pauses, and is good for applications that have a
relatively large set of long-lived data, and that run on machines with two or more
processors, such as web servers.

+CMSParallelRemarkEnabled: For the CMS GC, enables the garbage collector to
use multiple threads during the CMS remark phase. This decreases the pauses during
this phase.

ServivorRatio: Controls the size of the two survivor spaces. It's a ratio between
the survivor space size and Eden. The default is 25. There's not much bang for the
buck here, but it may need to be adjusted.

ParallelGCThreads: The number of threads to use for parallel garbage collection.
Should be equal to the number of CPU cores in your server.

A sample configuration using the above parameters might look something like
this:
JAVA_OPTS="$JAVA_OPTS -XX:NewSize=700m -XX:MaxNewSize=700m -Xms2048m
-Xmx2048m -XX:MaxPermSize=128m -XX:+UseParNewGC -XX:+UseConcMarkSweepGC -XX:
+CMSParallelRemarkEnabled -XX:SurvivorRatio=20 -XX:ParallelGCThreads=8"

WAS concepts : node, cell ,cluster

A good explanation of cell node and cluster is provided in the below given link  https://itdevworld.wordpress.com/2009/05/03/websphere-c...